
CBAM benchmarks: how free allocation reduces the certificates on your goods
A CBAM benchmark is the tonnes of CO₂e per tonne of good that an EU producer would receive as free allocation under the EU ETS. The importer deducts it, scaled by the CBAM factor, before buying certificates. Which benchmark applies depends on the CN code, the production route and whether the declaration uses actual data or default values.
Published 4 November 2026 · Reflects Commission guidance of 14 August 2026
Under Regulation (EU) 2023/956 an authorised CBAM declarant surrenders certificates for the emissions embedded in imported goods, less an adjustment that mirrors the free allocation EU producers still receive under the EU Emissions Trading System. That adjustment is calculated from CBAM benchmarks. This guide explains what the benchmarks are, where the numbers come from, how the CBAM factor phases them out between 2026 and 2034, and what the operator of an installation outside the EU has to supply so that the right benchmark is applied to its goods.
What a CBAM benchmark is
A CBAM benchmark is a value in tonnes of CO₂e per tonne of good, set by the Commission for each CN code in the table in point 5 of the Annex to Implementing Regulation (EU) 2025/2620, the act on the calculation of the free allocation adjustment. It represents the free allocation an EU installation making the same good would receive under the EU ETS.
The benchmark is not an emissions figure for your plant and it is not a default value. Default values (Implementing Regulation (EU) 2025/2621) are set per country of origin and stand in for missing emissions data. Benchmarks are the same for every country: the Commission's guidance states that, unlike default values, benchmark values apply equally for all countries. What changes the benchmark for a given CN code is the production route, and for a few goods the production year.
The Commission published the benchmark table as an information-only Excel file for the definitive period in February 2026. The legal text is the Annex to IR (EU) 2025/2620.
Where benchmarks come from: EU ETS free allocation
EU installations in the CBAM sectors receive part of their EU ETS allowances for free. Each installation is split into sub-installations, and each sub-installation receives its EU ETS product benchmark multiplied by its historical production. CBAM was designed so that an importer pays the same carbon cost as an EU producer: emissions minus free allocation.
EU ETS benchmarks do not map cleanly onto CN codes, and they do not account for precursors bought from other plants. So the Commission derived dedicated CBAM benchmarks from the EU ETS benchmarks, adjusted to the CBAM system boundaries, and defined them for every simple and complex CBAM good, for single production processes and for whole production chains.
For electricity (CN 2716 00 00) the free allocation adjustment is zero: electricity producers do not receive free allocation in the EU ETS.
The CBAM factor: 97.5% in 2026, 0% in 2034
The benchmark is never deducted in full. It is multiplied by the CBAM factor referred to in Article 10a(1a) of the EU ETS Directive, which falls each year as free allocation is phased out for CBAM sectors, and by the cross-sectoral correction factor (CSCF).
| Year | CBAM factor | Share of the benchmark charged instead |
|---|---|---|
| 2026 | 97.5% | 2.5% |
| 2027 | 95.0% | 5% |
| 2028 | 90.0% | 10% |
| 2029 | 77.5% | 22.5% |
| 2030 | 51.5% | 48.5% |
| 2031 | 39.0% | 61% |
| 2032 | 26.5% | 73.5% |
| 2033 | 14.0% | 86% |
| 2034 | 0% | 100% |
Commission Guidance No. 4 lists the CSCF as 1.0 for every year in its table and marks those values as preliminary; values for 2026 to 2030 are set in Commission Implementing Decision (EU) 2026/1862. The practical reading: in 2026 a good is charged on its embedded emissions minus almost its whole benchmark. By 2030 roughly half the benchmark is gone, and from 2034 there is nothing left to deduct.
The benchmark matters most in the early years. A plant whose embedded emissions sit close to its benchmark pays little in 2026 and progressively more each year, even if its emissions do not change.
How the free allocation adjustment is calculated
Article 31 of Regulation (EU) 2023/956 and the Annex to IR (EU) 2025/2620 set the arithmetic. For each imported good g in year y:
FAA(g) = SEFA(g,y) × M(g)
where FAA is the free allocation adjustment, SEFA the specific embedded free allocation in tCO₂e per tonne of good, and M the mass imported in the year the declaration covers.
When actual data is used, the operator calculates SEFA for each production process:
SFA(process) = CBAM factor(y) × CSCF(y) × BM*(g)
For a simple good, SEFA equals that process value. For a complex good, the SEFA of each precursor is added, weighted by the specific mass of precursor used per tonne of good:
SEFA(g,y) = SFA(process) + Σ m(i,y) × SEFA(i)
Precursors from the EU, and from the countries exempted in point 1 of Annex III to the CBAM Regulation, count as zero free allocation, just as their embedded emissions do.
The adjustment then enters the number of certificates the declarant surrenders: embedded emissions minus the free allocation adjustment, minus any eligible carbon price paid in the country of production, with a floor of zero. The full formula is on the CBAM certificate price page.
Column A, column B and the production route
The benchmark table in IR (EU) 2025/2620 has two columns, and choosing the wrong one is the most common error:
- Column A (BM*) is the benchmark for the production process alone. It applies when SEFA is built from actual data, process by process, with precursors added on top.
- Column B (BM) covers the whole production chain, precursors already included. It applies when the declaration uses default values for the good.
For a simple good the two columns are equal. For a finished steel bar they are far apart: rolling alone carries a small benchmark, while the chain from iron ore or scrap to bar carries the large one.
Some CN codes carry several values marked with a letter. For steel the letter is the production route: (C) carbon steel from blast furnace and basic oxygen furnace, (D) carbon steel from direct reduced iron and electric arc furnace, (E) carbon steel from scrap and electric arc furnace, and (F), (G), (H) for the same three routes in low alloy steel, with (J) for high alloy steel. Aluminium is split into (K) primary and (L) secondary aluminium, and cement clinker into grey and white clinker. A few values depend on the production year instead: (1) for 2026 to 2027 and (2) for 2028 to 2030.
The letters in the benchmark table are condition codes, not the column names. Grey clinker is coded (A) and white clinker (B) inside both column A and column B. Read the code against the definitions in the Annex before you pick a value.
Which benchmark applies when default values are used
If the declarant has no verified actual data and uses a default value for the good's embedded emissions, the free allocation adjustment must also be calculated on defaults: SEFA = CBAM factor × CSCF × the Column B benchmark.
The declarant usually does not know the production route of a plant it has never seen. The rules solve that by reading the route from the default value tables in Annex I to IR (EU) 2025/2621: the last column of each country table names the production route used to determine the benchmark. If the country of origin is unknown, the route comes from the table for other countries and territories, or from Annex IV for a precursor.
So a default declaration fixes two things at once: a marked-up default emissions value and a benchmark based on the route the Commission assumed for that country. An installation on a lower-emitting route than the one assumed gets no credit for it unless actual data is supplied.
What the operator of an installation has to supply
Only the authorised declarant calculates the final free allocation adjustment. But when actual values are used, the inputs come from the installation, and IR (EU) 2025/2547 and the Free Allocation Adjustment Act set what they must contain. The Commission's guidance states that the verified operator's emissions report contains all necessary information on SEFA. In practice that means:
- the CN code and the production process each good belongs to, with its production route where the benchmark depends on it;
- the production year of the goods, which decides the year-dependent benchmarks and the CBAM factor;
- for complex goods, the mass of each precursor consumed per tonne of good, its country of origin and the SEFA from the supplier's verification report, or the default where none exists;
- a verification report from an accredited verifier covering the reporting period, without which the declarant cannot use the actual values.
A plant that monitors these items well gives its importer the lower of two numbers twice: actual embedded emissions instead of a marked-up default, and the benchmark of its real route instead of an assumed one.
Example CBAM benchmarks by good and route
Selected rows from the Commission benchmark file for the definitive period (IR (EU) 2025/2620, Annex point 5). Values in tCO₂e per tonne of good.
Column A per process · Column B whole chain
IR (EU) 2025/2620| CN code | Good | Column A (BM*) | Column B (BM) | Condition |
|---|---|---|---|---|
| 2523 10 00 | Cement clinker | 0.666 / 0.859 | 0.666 / 0.859 | Grey clinker (A) / white clinker (B) |
| 2814 10 00 | Anhydrous ammonia | 1.522 | 1.522 | Simple good, columns equal |
| 7207 11 11 | Semi-finished non-alloy steel | 0.188 / 0.065 / 0.065 | 1.364 / 0.475 / 0.066 | Routes (C) / (D) / (E) |
| 7214 20 00 | Reinforcing bars | 0.038 | 1.364 / 0.475 / 0.066 | Column B by route (C) / (D) / (E) |
| 7604 29 10 | Bars and rods of aluminium alloys | 0.056 | 1.485 / 0.148 | Primary (K) / secondary (L) |
| 7610 10 00 | Aluminium doors, windows and frames | 0.060 | 1.493 / 0.152 | Primary (K) / secondary (L) |
Finding the benchmark for one of your goods
Classify the good
Fix the route and year
Pick the column
Apply the factor
The production route travels with every good.
Each good in the CBAM module carries its CN code and production route, and the completeness check will not pass until every good has a route its benchmark can resolve against. The indicative cost curve to 2034 deducts the free allocation year by year, so the effect of the falling CBAM factor is visible before a declarant ever asks.
- Production route set per good, checked before export
- Indicative certificate cost curve 2026 to 2034
- Operator’s emissions report workbook in the official 2026 shape
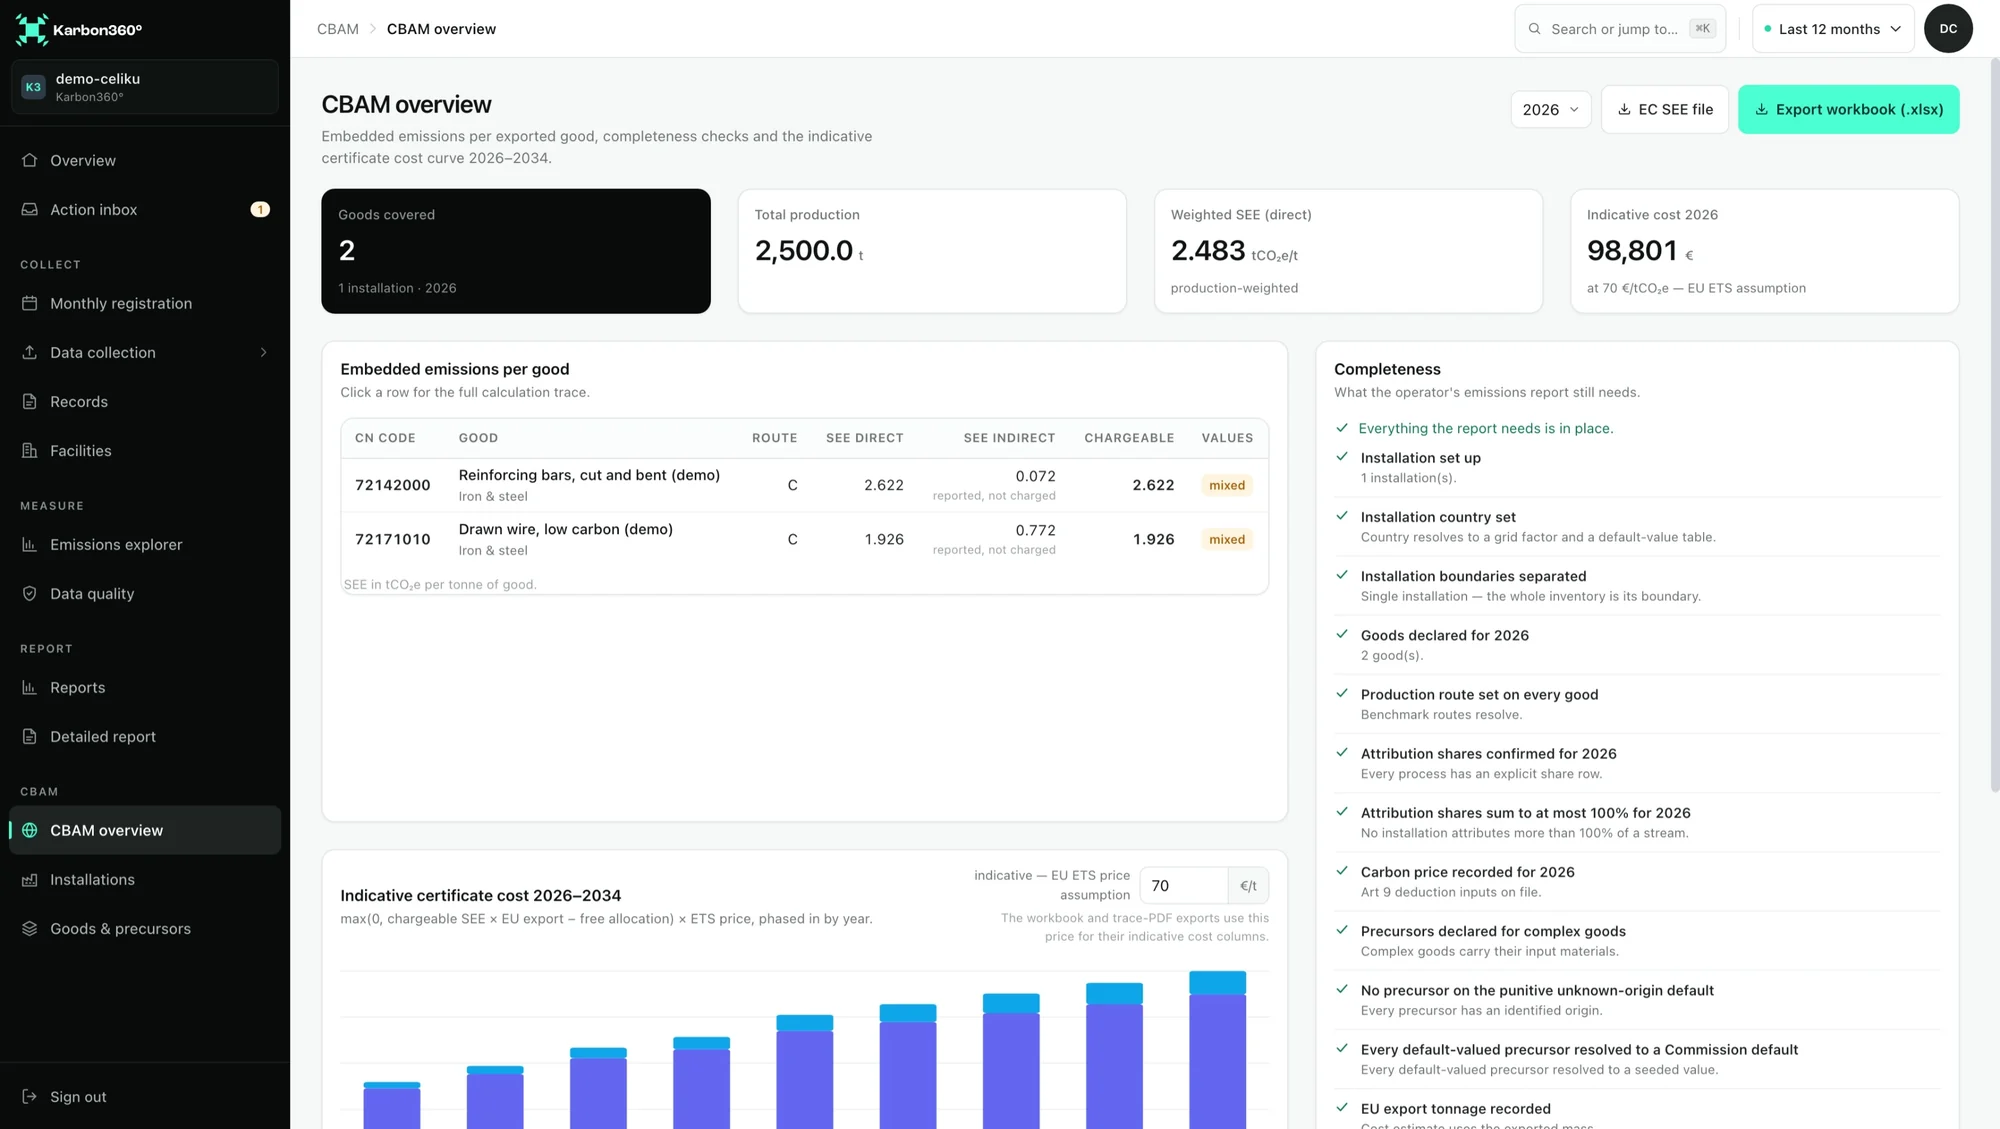
− free allocation) × ETS price
Frequently asked questions
What is a CBAM benchmark?
A value in tCO₂e per tonne of good, set per CN code in the Annex to Implementing Regulation (EU) 2025/2620, that reflects the free allocation an EU producer of the same good would receive under the EU ETS. Scaled by the CBAM factor, it reduces the number of CBAM certificates the declarant must surrender.
Is the CBAM benchmark the same as the default value?
No. Default values (IR (EU) 2025/2621) estimate embedded emissions per country of origin when actual data is missing, and carry a mark-up. Benchmarks estimate free allocation and are the same for every country. They meet only in one place: when defaults are used, the production route listed in the default value table decides which benchmark applies.
How does CBAM free allocation phase out?
Through the CBAM factor: 97.5% of the benchmark is deducted in 2026, 95% in 2027, 90% in 2028, 77.5% in 2029, 51.5% in 2030, 39% in 2031, 26.5% in 2032 and 14% in 2033. From 2034 the factor is zero and no adjustment remains.
Why does the production route matter?
For steel and aluminium the benchmark depends on the route. A whole-chain steel benchmark is 1.364 tCO₂e/t for blast furnace and basic oxygen furnace, 0.475 for direct reduced iron with an electric arc furnace and 0.066 for scrap-based electric arc furnace. The route also decides how the operator splits the installation into production processes.
Does a non-EU producer calculate the free allocation adjustment?
The declarant calculates the final adjustment for its declaration. Where actual values are used, the operator calculates the specific embedded free allocation for its goods and includes it in the operator’s emissions report, which an accredited verifier then checks.
- European Commission — CBAM legislation and guidance (benchmarks and default values files)
- Regulation (EU) 2023/956 establishing the CBAM (EUR-Lex)
- Implementing Regulation (EU) 2025/2620 on the free allocation adjustment (EUR-Lex)
- Implementing Regulation (EU) 2025/2621 on default values (EUR-Lex)
- European Commission — EU ETS free allocation
Know your route before the declarant guesses it.
Set each good’s CN code and production route once, and the benchmark, the free allocation and the indicative cost follow from your own installation data.