
Carbon footprint calculator for manufacturing: a first Scope 1 and 2 range for your factory.
Enter your factory’s annual electricity use and fuel spend. The calculator returns a screening range for Scope 1 and Scope 2 in tonnes of CO₂e and the list of what a customer, a bank or a CBAM request will ask you to evidence. It is a first number, built honestly from generic coefficients, not a footprint report.
- 1Your factory’s energy use
- 2Your emissions estimate is ready
- 3Estimated annual footprint
Your factory’s energy use
Rough annual figures are fine. This is a screening estimate for your company, not a footprint report.
How the manufacturing calculator works.
From your inputs to a range
Every carbon footprint calculation is the same multiplication: activity data times an emission factor. The calculator applies it to two activities:
- Scope 2, electricity. Your annual kWh times a rough midpoint for the electricity grid of the country you select. This follows the location-based idea: the emissions of the grid where the electricity was consumed.
- Scope 1, fuels. Your annual fuel spend in euros, for vehicles and for furnaces, boilers, kilns and machinery, converted with a generic coefficient for each.
The two are added and shown as a range from 35% below to 35% above the central figure, with the Scope 1 and Scope 2 split. Spend is a rough proxy for litres and cubic metres, which is why the result is a range and not a number.
What to have ready
- Annual electricity consumption in kWh, from your twelve monthly invoices. This is usually the most important input.
- Annual fuel spend for vehicles: diesel and petrol for trucks, vans, cars and forklifts.
- Annual fuel spend for heat and machinery: natural gas, heating oil, diesel for generators, coal, wood or LPG.
- Sector, country, employees and number of facilities, so the result and the evidence list fit your situation.
- What prompted the check: a customer, a bank, CBAM, or planning ahead. The evidence list changes with it.
What drives a factory’s carbon footprint
In a manufacturing plant the footprint usually sits in three places:
- Stationary combustion (Scope 1): boilers, furnaces, kilns, dryers, ovens and back-up generators.
- Process emissions (Scope 1): CO₂ released by the chemistry of production, such as heating limestone for clinker or lime, glass and ceramics, and steel and aluminium production.
- Purchased electricity and heat (Scope 2): motors, compressors, electric furnaces, lighting and district heating.
Company vehicles and forklifts add mobile combustion to Scope 1. On a lignite-heavy grid, electricity is often the largest line, which is why the country you select moves the result so much.
What a screening calculator leaves out
Three things are outside this estimate:
- Process emissions. They depend on tonnes produced and on the process, not on spend. If you make clinker, lime, glass, ceramics, steel or aluminium, your real Scope 1 is higher than the fuel line suggests.
- Scope 3. Purchased materials, transport and the other value-chain categories are not estimated.
- A per-product footprint. A buyer asking for kg CO₂e per kg of product needs installation data allocated to goods. See product carbon footprint.
Where each energy source in a factory goes.
The same split a real inventory uses, with the document each line is built from.
Factory sources by scope
GHG Protocol Corporate Standard| Source | Scope and category | Document |
|---|---|---|
| Natural gas in boilers, furnaces and kilns | Scope 1 · stationary combustion | Gas invoices (m³ or kWh) |
| Diesel for back-up generators | Scope 1 · stationary combustion | Generator logbook or fuel receipts |
| Trucks, vans, cars and forklifts | Scope 1 · mobile combustion | Fuel cards or receipts (litres) |
| Clinker, lime, glass, ceramics, steel or aluminium production | Scope 1 · process emissions | Production records (tonnes per month) |
| Grid electricity | Scope 2 · purchased electricity | Monthly electricity invoices (kWh) |
| District heating | Scope 2 · heating and cooling | Heat bills |
| Business travel and employee commuting | Scope 3 · categories 6 and 7 | Travel records and a staff survey |
What a real factory inventory adds.
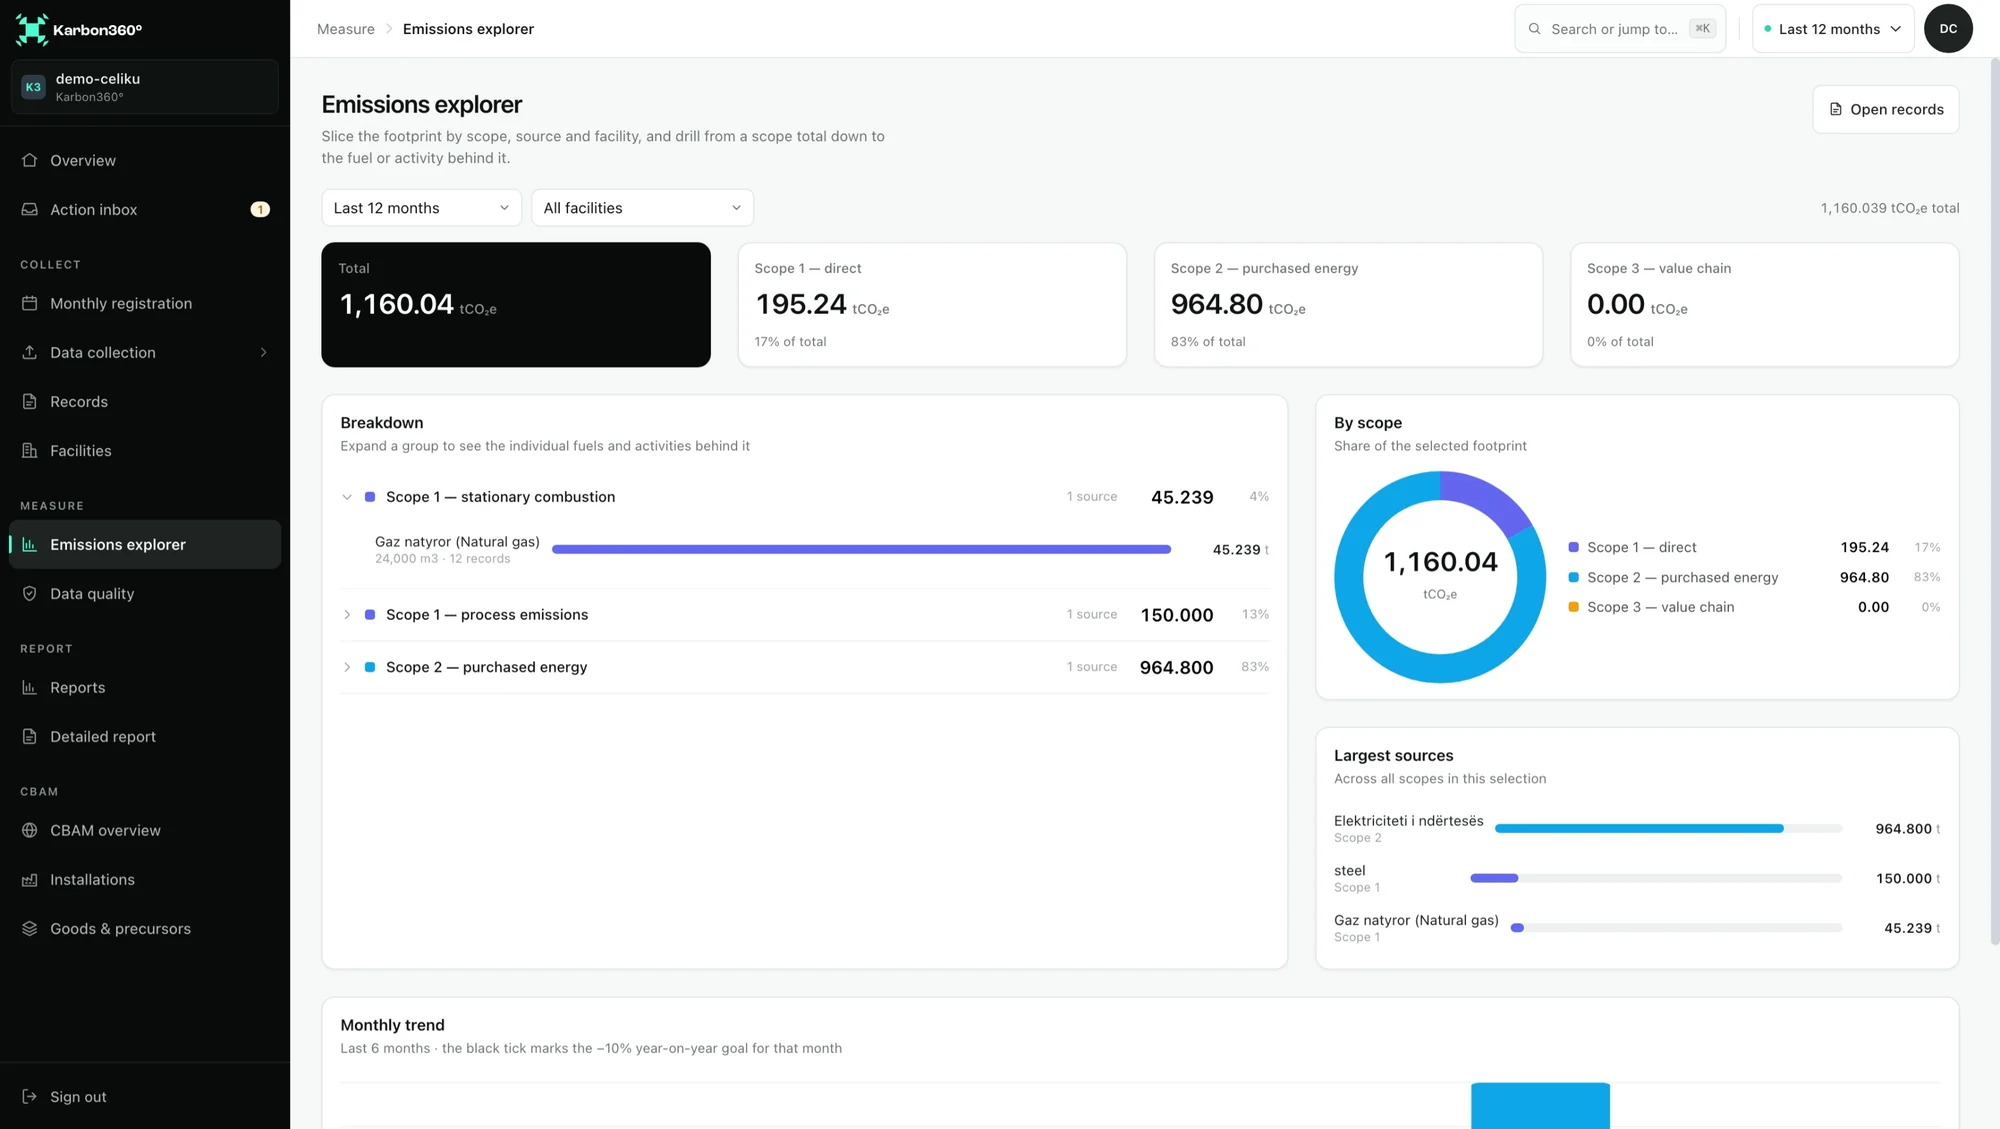
The estimate turns a year of spend into a range. An inventory records the actual quantities month by month, for each facility, from the invoice or meter reading behind them. Each record is calculated with the factor for the facility’s country from a sourced, versioned library, and keeps the document as evidence.
Process emissions are entered in tonnes produced, separately from the fuel burned in the kiln or furnace, so the two are reported as distinct lines.
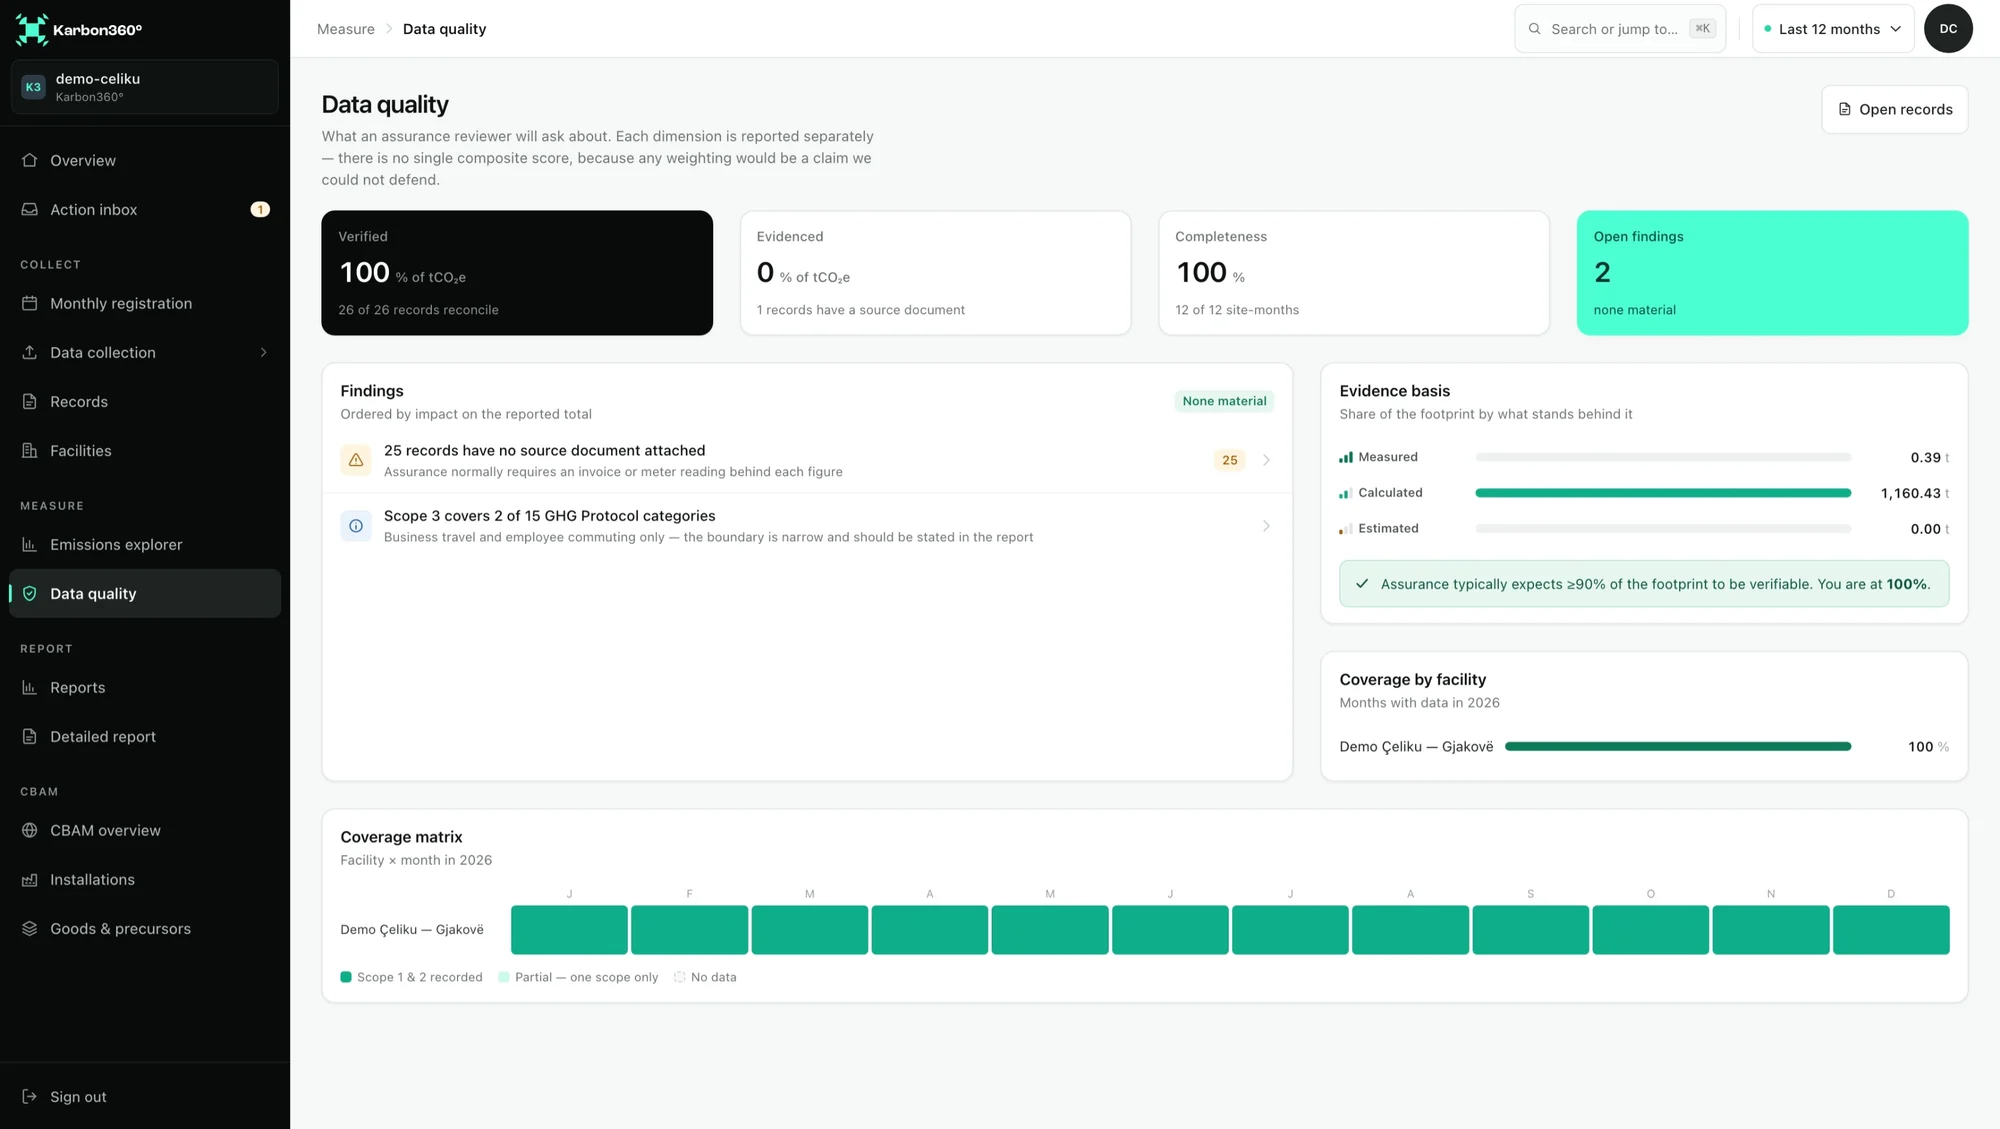
- Scan an invoice, enter it by hand or import a CSV
- Country grid factor applied and shown on every record
- Process emissions entered from production tonnes
Gaps stated, not smoothed over.
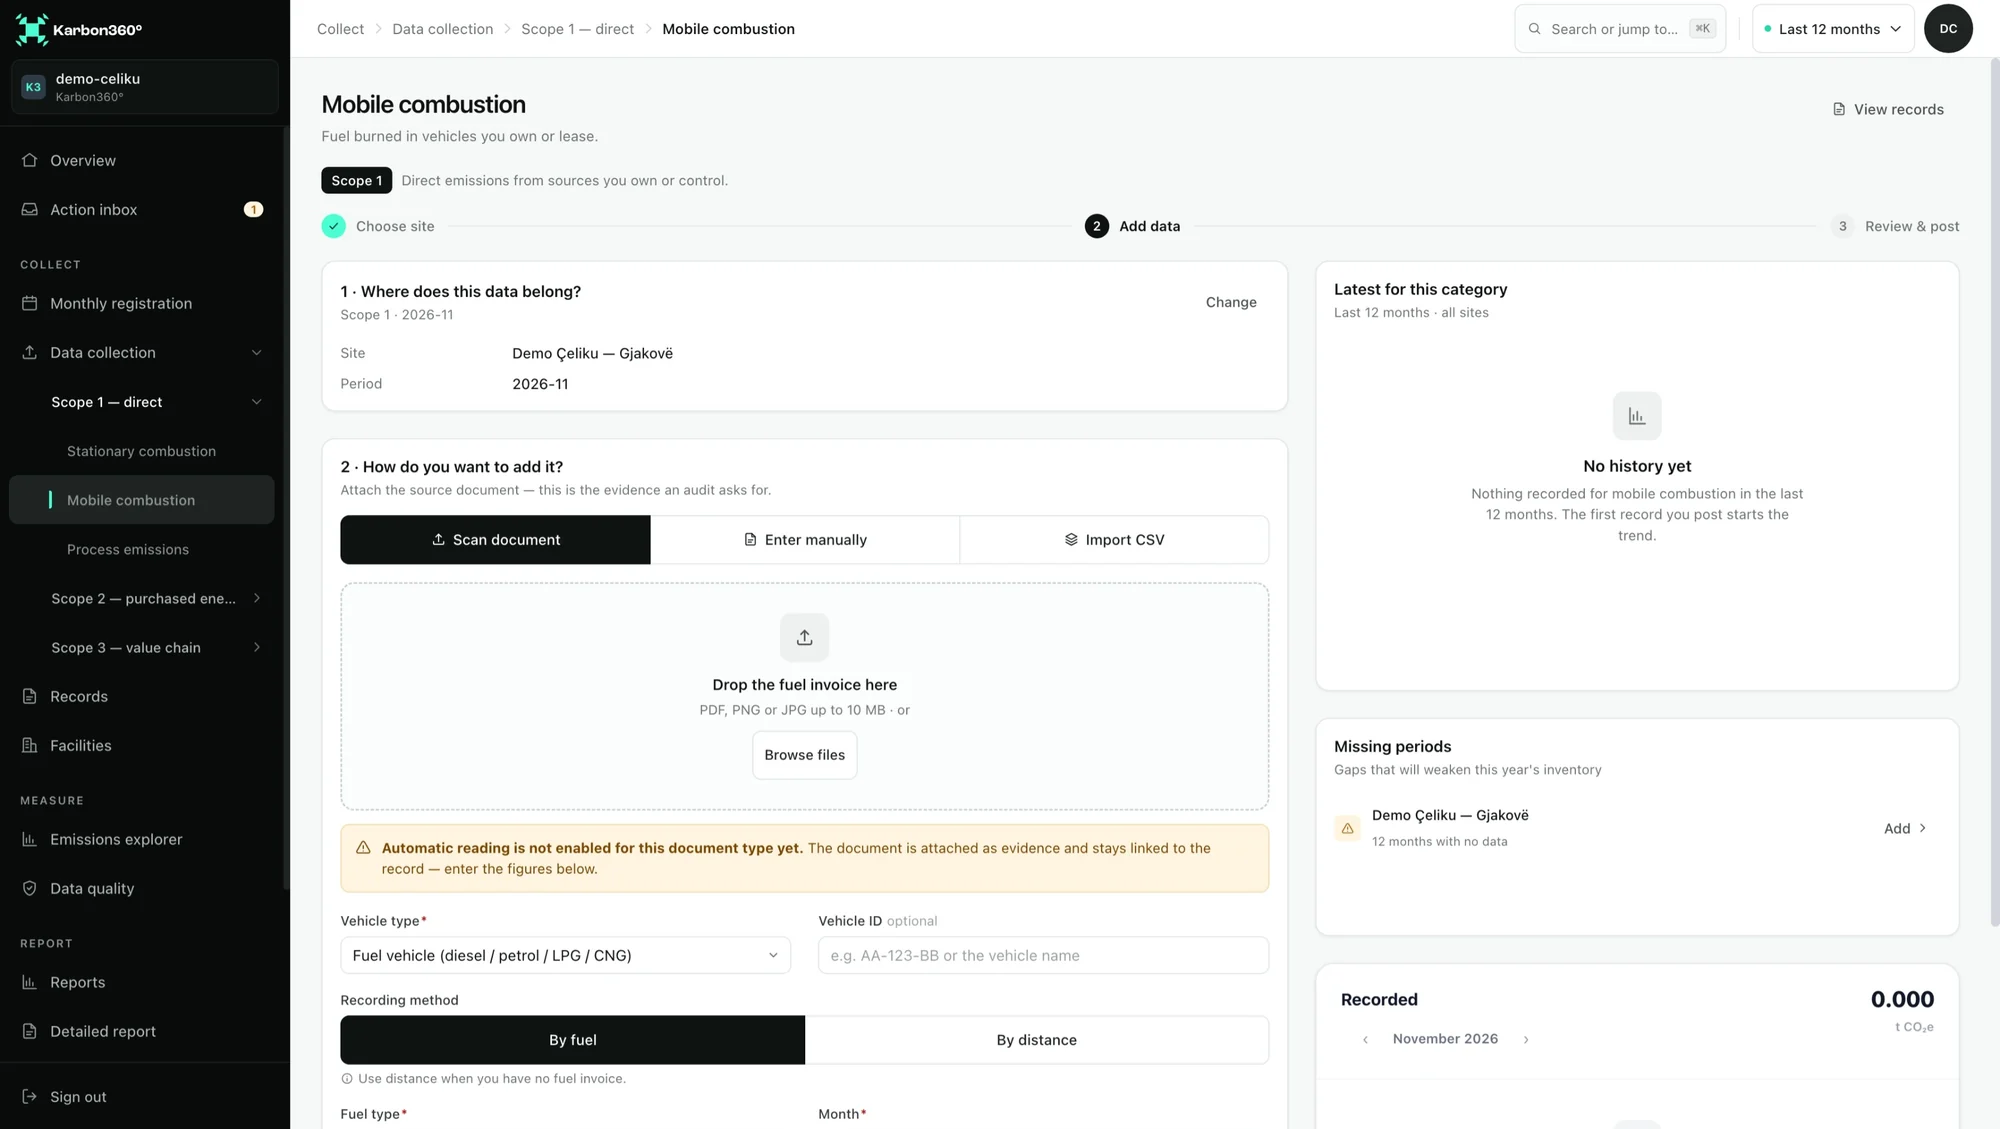
A footprint your customer or bank will rely on has to say what is missing. Karbon360 reports completeness by facility and month, lists findings ordered by their impact on the total, and shows how much of the footprint is measured, calculated or estimated.
That is the difference between a number you can hand to a reviewer and a number you have to defend from memory.
- Coverage matrix by facility and month
- Findings ordered by impact on the reported total
- Evidence basis: measured, calculated, estimated
From the estimate to a full Scope 1 and 2 inventory
Run the estimate
Collect twelve months
Set up facilities
Enter monthly, report
Frequently asked questions
Is this carbon footprint calculator for manufacturing free?
Yes. No account and no payment. You enter your work email on the second step to see the result, and we send it to you.
How accurate is the result?
It is a screening range of plus or minus 35% around a central estimate built from generic coefficients. It shows your order of magnitude. A real inventory uses your quantities, your country’s factor and your production records.
Does it include process emissions?
No. Process emissions depend on what you produce and how much, not on what you spend on fuel. In an inventory they are entered from production tonnes for processes such as clinker, lime, glass, ceramics, steel and aluminium.
Can I use the result for CBAM?
No. CBAM needs specific embedded emissions per good, calculated at installation level and verified by an accredited verifier. The CBAM calculator estimates the certificate cost once you have that figure.
Is there an Excel version?
The calculator runs in the browser and the results arrive by email. A full inventory in Karbon360 exports reports and, for CBAM goods, the operator’s emissions report workbook.
Replace the range with your factory’s number.
Monthly records from your invoices and production logs, the factor for your country on every record, and process emissions entered as their own line.